T20Grounds.
← The grounds

Kingsmead SA20 stats

Kingsmead is Durban's Super Giants' home ground. Its all-season SA20 first-innings mean is 166.8, with a median of 169.5, from 16 eligible innings. The source archive contains 20 matches here, so the match list and the main statistical sample answer slightly different questions.

SA2020 source matches4 seasons
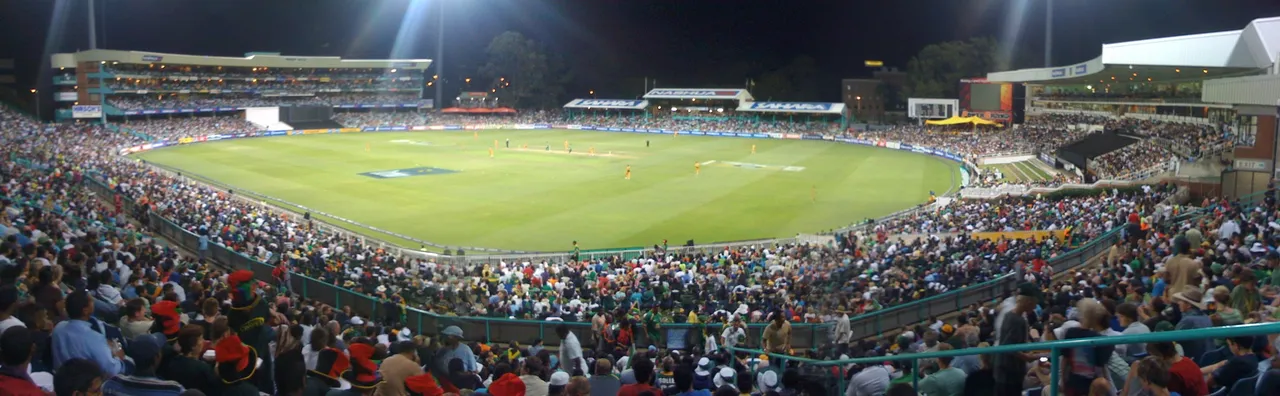
Kingsmead cricket ground under floodlights, surrounded by spectators during a night match in 2009.
A historical view of Kingsmead during an Australia–South Africa match, 2009. Marc Forrest / Wikimedia Commons · CC BY 2.0. Resized and converted to WebP; display crop varies.

Scores at a glance

Average 1st innings166.816 eligible innings
Median 1st innings169.5runs · same sample
Successful chases37.5%6 of 16 eligible results

All available seasons · 20 source matches. The season is saved in this page’s URL. Sample rules.

20 source matches across the available seasons supply 16 eligible first innings; 4 matches are excluded by the standard-match rules. The included totals range from 80 to 216, with a median of 169.5.

Inspect the matches behind these numbers ↓

First-innings scores by season

Compare the average with the middle score. The whole series stays visible; your selected season is highlighted.

First innings, season by season

Mean and median share a zero-based runs scale. Each season has its own sample.

  • Mean
  • Median
2022/23n = 4 innings
Mean162.8
Median177.5
2023/24n = 4 innings
Mean171.5
Median166.5
2024/25n = 4 innings
Mean171.2
Median167
2025/26n = 4 innings
Mean161.5
Median179.5

n counts eligible first innings, not every source match. These are historical outcomes; differences do not isolate the effect of the pitch.

View season chart data
Kingsmead · first-innings season data
SeasonSource matchesEligible innings (n)Mean runsMedian runs
2022/2354162.8177.5
2023/2454171.5166.5
2024/2554171.2167
2025/2654161.5179.5

Every score has a match behind it

Explore the eligible first innings in all available seasons. Select a point to see the teams, result and source.

Every eligible first innings

One point per match, oldest to newest. Equal spacing shows match order, not time between games.

16 eligible inningsRange 80–216 runsMean 166.8 runs

Select a point to inspect its score. With a point focused, use arrow keys to move, or Home / End. On smaller screens, scroll the plot sideways.

Kingsmead: 16 eligible first-innings totals in chronological order11 Jan 2023 · Joburg Super Kings 190/6 · 20.0 overs15 Jan 2023 · Durban's Super Giants 216/4 · 20.0 overs20 Jan 2023 · Durban's Super Giants 80/10 · 18.1 overs2 Feb 2023 · MI Cape Town 165/5 · 20.0 overs15 Jan 2024 · Durban's Super Giants 145/8 · 20.0 overs20 Jan 2024 · Durban's Super Giants 159/7 · 20.0 overs28 Jan 2024 · Durban's Super Giants 208/7 · 20.0 overs30 Jan 2024 · Durban's Super Giants 174/9 · 20.0 overs10 Jan 2025 · Durban's Super Giants 209/4 · 20.0 overs14 Jan 2025 · Joburg Super Kings 169/7 · 20.0 overs17 Jan 2025 · Sunrisers Eastern Cape 165/5 · 20.0 overs23 Jan 2025 · Durban's Super Giants 142/7 · 20.0 overs30 Dec 2025 · Durban's Super Giants 86/10 · 17.1 overs7 Jan 2026 · Pretoria Capitals 201/4 · 20.0 overs17 Jan 2026 · Durban's Super Giants 189/7 · 20.0 overs21 Jan 2026 · Sunrisers Eastern Cape 170/7 · 20.0 overs
Match 16 of 16 · 21 Jan 2026 · 2025/26170/720.0 overs

Sunrisers Eastern Cape batting first against Pretoria Capitals.

Pretoria Capitals won

Cricsheet source archive ↗File: 1494283.json · eligible first innings
16 / 16

4 of 20 source matches omitted from this chart. Only eligible first innings are plotted; a low all-out total is not automatically excluded. The dashed line is the mean of these 16 innings.

View all 16 plotted scores
Kingsmead · eligible first innings in chronological order
No.DateBatting firstScoreOversSource file
111 Jan 2023Joburg Super Kings190/620.01343942.json in archive
215 Jan 2023Durban's Super Giants216/420.01343948.json in archive
320 Jan 2023Durban's Super Giants80/1018.11343955.json in archive
42 Feb 2023MI Cape Town165/520.01343963.json in archive
515 Jan 2024Durban's Super Giants145/820.01392658.json in archive
620 Jan 2024Durban's Super Giants159/720.01392663.json in archive
728 Jan 2024Durban's Super Giants208/720.01392673.json in archive
830 Jan 2024Durban's Super Giants174/920.01392675.json in archive
910 Jan 2025Durban's Super Giants209/420.01449635.json in archive
1014 Jan 2025Joburg Super Kings169/720.01449641.json in archive
1117 Jan 2025Sunrisers Eastern Cape165/520.01449644.json in archive
1223 Jan 2025Durban's Super Giants142/720.01449651.json in archive
1330 Dec 2025Durban's Super Giants86/1017.11494258.json in archive
147 Jan 2026Pretoria Capitals201/420.01494268.json in archive
1517 Jan 2026Durban's Super Giants189/720.01494279.json in archive
1621 Jan 2026Sunrisers Eastern Cape170/720.01494283.json in archive

First-innings score distribution

First-innings totals ranged from 80 to 216 in this selection. Here is how those 16 eligible innings were distributed.

All available seasons. Each innings appears in one band.

Under 140
2 / 16
140–159
3 / 16
160–179
5 / 16
180–199
2 / 16
200+
4 / 16

Highest first innings

216/4

Durban's Super Giants against Paarl Royals, 15 Jan 2023.

20.0 overs · 2022–23

Cricsheet archive · match 1343948

Highest within the eligible first-innings sample. This is not an all-format ground record.

Explore the results

How often did a total hold up?

Choose a first-innings total. See the results of completed SA20 matches at Kingsmead where the opening score reached that mark or higher.

All available seasons · 16 eligible decided matches before the score filter. Reduced matches, DLS, ties and no-results are excluded.

80280
6 / 6

won batting first after scoring 180+
100% of this 6-match sample

Batting first: 6Chasing: 0

This describes past results, not the probability of defending a score next time. A higher threshold can leave a very small sample.

Inspect these 6 matches

Runs through the innings

PowerplayOvers 1-6
8.15 rpo
MiddleOvers 7-15
7.58 rpo
DeathOvers 16-20
10.07 rpo

Both regulation innings · eligible standard matches · total runs per six legal balls. Definitions ↗

Match scores and results

All available seasons. Find a team, inspect excluded matches, or export the rows you need. Date links open the source archive; the match ID identifies its JSON file.

20 of 20 source matches · showing 12

Match scores, results and inclusion in the statistical sample
Date & sourceMatch & scoreResultSample
21 Jan 2026 ↗2025–26 · ID 1494283
Sunrisers Eastern Cape170/7 (20.0)
Pretoria Capitals172/3 (18.3)
Pretoria Capitals won1st innings included
17 Jan 2026 ↗2025–26 · ID 1494279
Durban's Super Giants189/7 (20.0)
Paarl Royals131/9 (20.0)
Durban's Super Giants won1st innings included
7 Jan 2026 ↗2025–26 · ID 1494268
Pretoria Capitals201/4 (20.0)
Durban's Super Giants186/10 (19.4)
Pretoria Capitals won1st innings included
30 Dec 2025 ↗2025–26 · ID 1494258
Durban's Super Giants86/10 (17.1)
Joburg Super Kings88/4 (12.2)
Joburg Super Kings won1st innings included
28 Dec 2025 ↗2025–26 · ID 1494256
Durban's Super Giants37/0 (4.0)
MI Cape TownNo innings recorded
No resultExcludedNo result; Two regulation innings are not available; First innings did not complete 20 overs or exhaust available batters
23 Jan 2025 ↗2024–25 · ID 1449651
Durban's Super Giants142/7 (20.0)
Paarl Royals146/5 (17.3)
Paarl Royals won1st innings included
21 Jan 2025 ↗2024–25 · ID 1449649
MI Cape Town69/3 (11.0)
Durban's Super GiantsNo innings recorded
No resultExcludedNo result; Two regulation innings are not available; First innings did not complete 20 overs or exhaust available batters
17 Jan 2025 ↗2024–25 · ID 1449644
Sunrisers Eastern Cape165/5 (20.0)
Durban's Super Giants107/10 (18.1)
Sunrisers Eastern Cape won1st innings included
14 Jan 2025 ↗2024–25 · ID 1449641
Joburg Super Kings169/7 (20.0)
Durban's Super Giants141/10 (18.0)
Joburg Super Kings won1st innings included
10 Jan 2025 ↗2024–25 · ID 1449635
Durban's Super Giants209/4 (20.0)
Pretoria Capitals207/6 (20.0)
Durban's Super Giants won1st innings included
30 Jan 2024 ↗2023–24 · ID 1392675
Durban's Super Giants174/9 (20.0)
Pretoria Capitals166/9 (20.0)
Durban's Super Giants won1st innings included
28 Jan 2024 ↗2023–24 · ID 1392673
Durban's Super Giants208/7 (20.0)
Paarl Royals83/10 (13.2)
Durban's Super Giants won1st innings included

Search and order change this list only. Charts use the season selected above. CSV includes every filtered row, even rows not yet shown, with source and inclusion notes.

Leading players at this ground

All four seasons, regardless of the season filter · regular innings. These totals include a broader match sample than the scoring charts.

Most runs

BatterRunsBallsSR
H Klaasen444272163.24
Q de Kock400300133.33
MP Breetzke375271138.38
PWA Mulder239183130.6
AK Markram190135140.74

Most wickets

BowlerWicketsEconomy
Noor Ahmad157.27
KA Maharaj156.34
RJW Topley108.44
S Muthusamy95.62
CJ Dala87.9

Understanding Kingsmead

These notes use the fixed 2022/23–2025/26 archive, regardless of the filter above. They do not describe today’s pitch or weather.

Four innings can tell different stories

In 2025/26, Kingsmead's four eligible first innings had a mean of 161.5 but a median of 179.5. Durban's Super Giants' 86 all out against Joburg Super Kings on 30 December 2025 helps explain the gap. That completed innings belongs in the average even though it ended after 17.1 overs. Removing a low all-out score would change the question being answered.

Batting first and batting second

Chasing sides won six of the 16 eligible decided matches across all seasons, or 37.5%. Each of the four seasons contributes just four results. Within a four-match sample, changing one result from a defence to a chase win moves the percentage by 25 points. Compare the wins and total matches alongside the percentage, especially when checking a single Durban season.

How the scoring rate changed through an innings

The all-season pooled rate was 8.15 runs per over during overs 1–6, 7.58 during overs 7–15 and 10.07 during overs 16–20. Both regulation innings contribute, including partial phases. The figures show when scoring occurred; they do not identify a bowling style or demonstrate that humidity, tides or dew caused a change.

A high total still belongs in the record

Durban's Super Giants made 216/4 against Paarl Royals on 15 January 2023 and won by 27 runs. It is the highest first-innings total in the eligible Kingsmead sample. Read it alongside the low innings and season summaries: the archive contains both kinds of match, and neither extreme on its own supplies a dependable target for the next fixture.

What is the lowest SA20 first-innings score at Kingsmead?

Durban's Super Giants were all out for 80 against Pretoria Capitals on 20 January 2023, the lowest eligible first innings here in our four-season archive. Capitals reached 84/2 in 7.4 overs. The 86 all out discussed above belongs to 2025/26: it helps explain that season's average, but is not the all-season minimum.

Why are four source matches outside the main scoring sample?

The summaries apply the same eligibility rules at every ground. Shortened matches, modified results and no-results are excluded where those conditions apply. The individual match rows show the reasons; the broader archive remains useful for checking what was played.

Is this a Kingsmead pitch report for today's match?

This page describes recorded SA20 cricket. It does not contain an inspection of today's surface, a weather observation or confirmed team selections. Use the historical numbers as background, with current match information from the competition and teams.

Does the archive include every scheduled game in Durban?

No. A washout without deliveries may have no ball-by-ball file. The written examples use the 2022/23–2025/26 snapshot reviewed on 19 October 2026; its match count is a source-coverage count rather than a complete fixture list.

Venue background: Official SA20 guide to Kingsmead ↗ · Cricsheet ball-by-ball data ↗

A practical guide to reading these statistics ↗