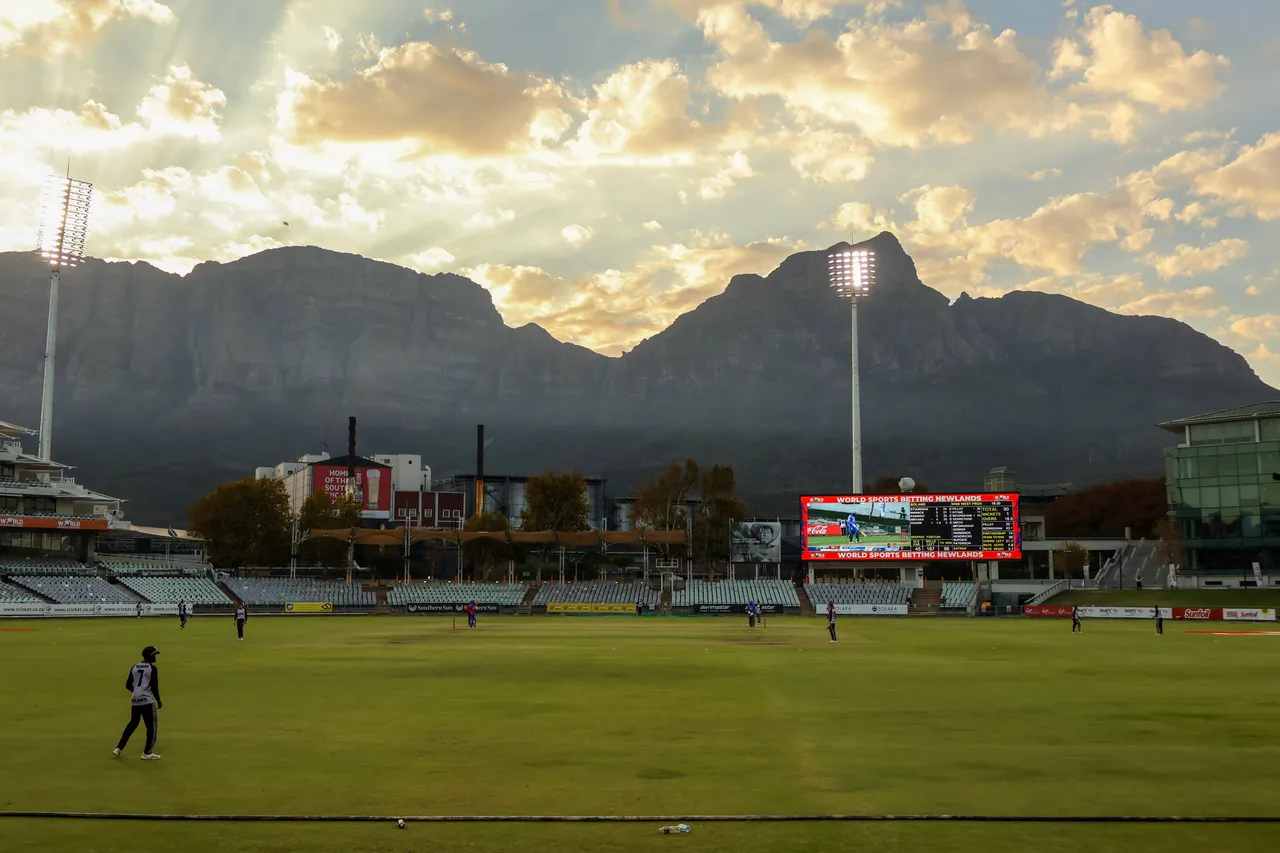
Newlands, the home of MI Cape Town, has an average first-innings score of 164 in our all-season SA20 sample, with a median of 163. Those figures come from 21 eligible innings. The close averages give a useful starting point, but the individual matches show how wide the scoring range can be.
SA2023 source matches4 seasons
Newlands Cricket Ground during Western Province v Boland, March 2026. EGilham / Wikimedia Commons · CC BY-SA 4.0. Resized and converted to WebP; display crop varies.
Scores at a glance
Average 1st innings16421 eligible innings
Median 1st innings163runs · same sample
Successful chases57.1%12 of 21 eligible results
All available seasons · 23 source matches. Reduced matches, DLS and other exclusions affect each sample. See rules.
Runs through the innings
PowerplayOvers 1-6
7.97 rpo
MiddleOvers 7-15
7.9 rpo
DeathOvers 16-20
9.74 rpo
Both regulation innings · eligible standard matches · total runs per six legal balls. Definitions ↗
Beyond the average
First-innings totals ranged from 88 to 232 in this selection. Here is how those 21 eligible innings were distributed.
All available seasons. Each innings appears in one band.
Under 140
4 / 21
140–159
6 / 21
160–179
5 / 21
180–199
1 / 21
200+
5 / 21
Highest first innings
232/5
Durban's Super Giants against MI Cape Town, 26 Dec 2025.
ExcludedModified result method: D/L; First innings did not complete 20 overs or exhaust available batters; Chase allocation is reduced; Chase target differs from first innings plus one
The notes below use all four seasons, regardless of the filter above.
A season with both 232 and 88
Durban's Super Giants made 232/5 here on 26 December 2025 and beat MI Cape Town by 15 runs. Nine days later, MI Cape Town were all out for 88 against Paarl Royals. Both innings belong to the 2025/26 sample. That season's mean was 167.4 and its median 158: a single headline score would give a very different impression from the five included first innings.
What the chasing record says
Teams batting second won 12 of the 21 eligible decided matches across all seasons, a 57.1% success rate. In the inaugural 2022/23 season they won four of five; in 2023/24 they won two of six. Read those as small sets of results. The figures do not separate the effect of the toss, the target or the strength of the teams.
The first six overs and the finish
Across both regulation innings of the eligible matches, scoring ran at 7.97 runs per over in the powerplay and 7.90 in overs 7–15. It rose to 9.74 in overs 16–20. These pooled rates describe the deliveries bowled. An early completed chase contributes no balls to the later phases, so the final-overs sample contains a different mix of innings.
Compare Newlands with Paarl by season
Boland Park's all-season first-innings mean is lower, at 157.5. Select 2025/26, however, and Paarl's 171.4 exceeds Newlands' 167.4, with five eligible innings at each ground. The comparison changes with the period. Use the same season on both pages, then inspect the match totals before deciding how much weight to give a difference.
What is a good first-innings score at Newlands?
The historical mean of 164 and median of 163 describe this SA20 sample; neither is a guaranteed winning total. To assess a particular score, check its season, the opposition and the actual match situation. This page does not observe the next match's pitch or weather.
Do these figures include Newlands T20 internationals?
No. They cover SA20 only. Tests, one-day cricket, internationals and other domestic tournaments are outside the sample. A general Newlands record table may combine different competitions and therefore produce a different average.
Which period do these examples cover?
The written analysis uses the four source seasons from 2022/23 to 2025/26 in the snapshot reviewed on 19 October 2026. Season-specific examples are labelled. The season selector changes the statistical tables; these historical examples remain fixed.