T20Grounds.
← The grounds

The Wanderers SA20 stats

The Wanderers is Joburg Super Kings' home ground in Johannesburg. Across the four SA20 seasons in this snapshot, its eligible first-innings mean is 166.8 and its median is 167.5. The page separates that 20-innings scoring sample from the 19 decided matches used for the chasing record.

SA2025 source matches4 seasons
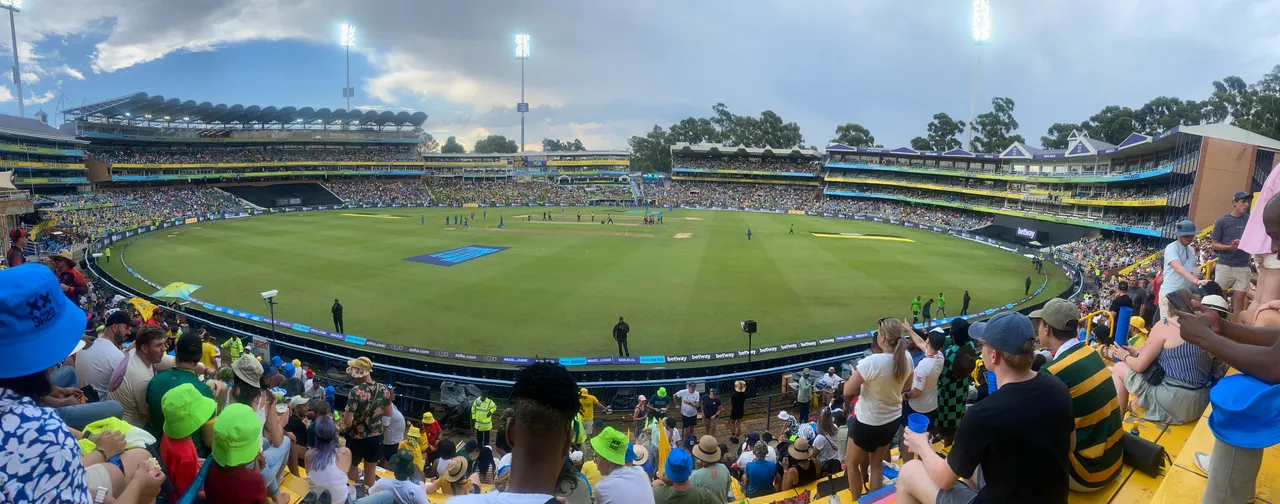
Spectators surrounding the Wanderers cricket field during an SA20 match.
Wanderers Stadium during Joburg Super Kings v MI Cape Town, SA20, January 2024. TapticInfo / Wikimedia Commons · CC BY 4.0. Resized and converted to WebP; display crop varies.

Scores at a glance

Average 1st innings166.820 eligible innings
Median 1st innings167.5runs · same sample
Successful chases52.6%10 of 19 eligible results

All available seasons · 25 source matches. The season is saved in this page’s URL. Sample rules.

Eligible first-innings scores run from 78 to 243 across the available seasons, a spread of 165 runs. The 166.8 average compresses those 20 innings into one number; the score bands show how they are distributed.

Inspect the matches behind these numbers ↓

First-innings scores by season

Compare the average with the middle score. The whole series stays visible; your selected season is highlighted.

First innings, season by season

Mean and median share a zero-based runs scale. Each season has its own sample.

  • Mean
  • Median
2022/23n = 6 innings
Mean163.8
Median164
2023/24n = 7 innings
Mean172.6
Median168
2024/25n = 3 innings
Mean149.7
Median150
2025/26n = 4 innings
Mean174
Median174

n counts eligible first innings, not every source match. These are historical outcomes; differences do not isolate the effect of the pitch.

View season chart data
The Wanderers · first-innings season data
SeasonSource matchesEligible innings (n)Mean runsMedian runs
2022/2376163.8164
2023/2477172.6168
2024/2563149.7150
2025/2654174174

Every score has a match behind it

Explore the eligible first innings in all available seasons. Select a point to see the teams, result and source.

Every eligible first innings

One point per match, oldest to newest. Equal spacing shows match order, not time between games.

20 eligible inningsRange 78–243 runsMean 166.8 runs

Select a point to inspect its score. With a point focused, use arrow keys to move, or Home / End. On smaller screens, scroll the plot sideways.

The Wanderers: 20 eligible first-innings totals in chronological order17 Jan 2023 · Joburg Super Kings 168/6 · 20.0 overs24 Jan 2023 · Durban's Super Giants 178/6 · 20.0 overs5 Feb 2023 · Joburg Super Kings 160/6 · 20.0 overs6 Feb 2023 · Joburg Super Kings 189/6 · 20.0 overs8 Feb 2023 · Pretoria Capitals 153/8 · 20.0 overs11 Feb 2023 · Pretoria Capitals 135/10 · 19.3 overs13 Jan 2024 · MI Cape Town 243/5 · 20.0 overs20 Jan 2024 · Pretoria Capitals 167/9 · 20.0 overs24 Jan 2024 · Joburg Super Kings 168/3 · 20.0 overs31 Jan 2024 · Joburg Super Kings 78/10 · 15.2 overs3 Feb 2024 · Durban's Super Giants 203/6 · 20.0 overs7 Feb 2024 · Paarl Royals 138/10 · 18.5 overs8 Feb 2024 · Durban's Super Giants 211/6 · 20.0 overs26 Jan 2025 · Sunrisers Eastern Cape 118/10 · 19.0 overs30 Jan 2025 · Paarl Royals 150/9 · 20.0 overs8 Feb 2025 · MI Cape Town 181/8 · 20.0 overs1 Jan 2026 · Joburg Super Kings 205/4 · 20.0 overs10 Jan 2026 · MI Cape Town 234/3 · 20.0 overs17 Jan 2026 · Pretoria Capitals 143/6 · 20.0 overs23 Jan 2026 · Paarl Royals 114/7 · 20.0 overs
Match 20 of 20 · 23 Jan 2026 · 2025/26114/720.0 overs

Paarl Royals batting first against Sunrisers Eastern Cape.

Sunrisers Eastern Cape won

Cricsheet source archive ↗File: 1494285.json · eligible first innings
20 / 20

5 of 25 source matches omitted from this chart. Only eligible first innings are plotted; a low all-out total is not automatically excluded. The dashed line is the mean of these 20 innings.

View all 20 plotted scores
The Wanderers · eligible first innings in chronological order
No.DateBatting firstScoreOversSource file
117 Jan 2023Joburg Super Kings168/620.01343951.json in archive
224 Jan 2023Durban's Super Giants178/620.01343962.json in archive
35 Feb 2023Joburg Super Kings160/620.01343967.json in archive
46 Feb 2023Joburg Super Kings189/620.01343969.json in archive
58 Feb 2023Pretoria Capitals153/820.01343971.json in archive
611 Feb 2023Pretoria Capitals135/1019.31343973.json in archive
713 Jan 2024MI Cape Town243/520.01392655.json in archive
820 Jan 2024Pretoria Capitals167/920.01392664.json in archive
924 Jan 2024Joburg Super Kings168/320.01392668.json in archive
1031 Jan 2024Joburg Super Kings78/1015.21392676.json in archive
113 Feb 2024Durban's Super Giants203/620.01392680.json in archive
127 Feb 2024Paarl Royals138/1018.51392683.json in archive
138 Feb 2024Durban's Super Giants211/620.01392684.json in archive
1426 Jan 2025Sunrisers Eastern Cape118/1019.01449655.json in archive
1530 Jan 2025Paarl Royals150/920.01449659.json in archive
168 Feb 2025MI Cape Town181/820.01449667.json in archive
171 Jan 2026Joburg Super Kings205/420.01494261.json in archive
1810 Jan 2026MI Cape Town234/320.01494272.json in archive
1917 Jan 2026Pretoria Capitals143/620.01494280.json in archive
2023 Jan 2026Paarl Royals114/720.01494285.json in archive

First-innings score distribution

First-innings totals ranged from 78 to 243 in this selection. Here is how those 20 eligible innings were distributed.

All available seasons. Each innings appears in one band.

Under 140
5 / 20
140–159
3 / 20
160–179
5 / 20
180–199
2 / 20
200+
5 / 20

Highest first innings

243/5

MI Cape Town against Joburg Super Kings, 13 Jan 2024.

20.0 overs · 2023–24

Cricsheet archive · match 1392655

Highest within the eligible first-innings sample. This is not an all-format ground record.

Explore the results

How often did a total hold up?

Choose a first-innings total. See the results of completed SA20 matches at The Wanderers where the opening score reached that mark or higher.

All available seasons · 19 eligible decided matches before the score filter. Reduced matches, DLS, ties and no-results are excluded.

80280
5 / 6

won batting first after scoring 180+
83.3% of this 6-match sample

Batting first: 5Chasing: 1

This describes past results, not the probability of defending a score next time. A higher threshold can leave a very small sample.

Inspect these 6 matches

Runs through the innings

PowerplayOvers 1-6
7.86 rpo
MiddleOvers 7-15
8.06 rpo
DeathOvers 16-20
10.11 rpo

Both regulation innings · eligible standard matches · total runs per six legal balls. Definitions ↗

Match scores and results

All available seasons. Find a team, inspect excluded matches, or export the rows you need. Date links open the source archive; the match ID identifies its JSON file.

25 of 25 source matches · showing 12

Match scores, results and inclusion in the statistical sample
Date & sourceMatch & scoreResultSample
23 Jan 2026 ↗2025–26 · ID 1494285
Paarl Royals114/7 (20.0)
Sunrisers Eastern Cape117/3 (11.4)
Sunrisers Eastern Cape won1st innings included
17 Jan 2026 ↗2025–26 · ID 1494280
Pretoria Capitals143/6 (20.0)
Joburg Super Kings122/8 (20.0)
Pretoria Capitals won1st innings included
10 Jan 2026 ↗2025–26 · ID 1494272
MI Cape Town234/3 (20.0)
Joburg Super Kings198/5 (20.0)
MI Cape Town won1st innings included
8 Jan 2026 ↗2025–26 · ID 1494269
Joburg Super Kings187/6 (20.0)
Paarl RoyalsNo innings recorded
No resultExcludedNo result; Two regulation innings are not available
1 Jan 2026 ↗2025–26 · ID 1494261
Joburg Super Kings205/4 (20.0)
Durban's Super Giants205/8 (20.0)
Match tied; Joburg Super Kings won the Super Over1st innings includedChase sample excluded
8 Feb 2025 ↗2024–25 · ID 1449667
MI Cape Town181/8 (20.0)
Sunrisers Eastern Cape105/10 (18.4)
MI Cape Town won1st innings included
1 Feb 2025 ↗2024–25 · ID 1449662
Durban's Super Giants173/4 (20.0)
Joburg Super Kings135/9 (16.0)
Durban's Super Giants wonD/LExcludedModified result method: D/L; Chase allocation is reduced; Chase target differs from first innings plus one
30 Jan 2025 ↗2024–25 · ID 1449659
Paarl Royals150/9 (20.0)
Joburg Super Kings151/3 (17.5)
Joburg Super Kings won1st innings included
26 Jan 2025 ↗2024–25 · ID 1449655
Sunrisers Eastern Cape118/10 (19.0)
Joburg Super Kings119/1 (14.0)
Joburg Super Kings won1st innings included
16 Jan 2025 ↗2024–25 · ID 1449643
Pretoria Capitals138/8 (20.0)
Joburg Super KingsNo innings recorded
No resultExcludedNo result; Two regulation innings are not available
11 Jan 2025 ↗2024–25 · ID 1449637
MI Cape Town140/6 (20.0)
Joburg Super Kings82/3 (11.3)
Joburg Super Kings wonD/LExcludedModified result method: D/L; Chase allocation is reduced; Chase target differs from first innings plus one
8 Feb 2024 ↗2023–24 · ID 1392684
Durban's Super Giants211/6 (20.0)
Joburg Super Kings142/10 (17.4)
Durban's Super Giants won1st innings included

Search and order change this list only. Charts use the season selected above. CSV includes every filtered row, even rows not yet shown, with source and inclusion notes.

Leading players at this ground

All four seasons, regardless of the season filter · regular innings. These totals include a broader match sample than the scoring charts.

Most runs

BatterRunsBallsSR
F du Plessis611397153.9
JL du Plooy502329152.58
H Klaasen284160177.5
D Ferreira269160168.12
RR Hendricks24925398.42

Most wickets

BowlerWicketsEconomy
LB Williams138.5
N Burger128.58
G Coetzee107.82
K Rabada96.73
L Sipamla96.42

Understanding The Wanderers

These notes use the fixed 2022/23–2025/26 archive, regardless of the filter above. They do not describe today’s pitch or weather.

243 and 78 in the same season

MI Cape Town made 243/5 at the Wanderers on 13 January 2024, winning by 98 runs. On 31 January, Joburg Super Kings were dismissed for 78 and Sunrisers Eastern Cape won by nine wickets. These are the highest and lowest first-innings totals in our eligible sample. Both come from 2023/24, whose seven innings averaged 172.6. The record total alone misses much of that season's variation.

Why the two sample counts differ

A regulation tie can supply a complete, eligible first innings without supplying a regulation winner. That is why the all-season mean uses 20 innings while the chase percentage uses 19 results. Teams batting second won 10 of those 19, or 52.6%. The subsequent Super Over does not turn a regulation tie into a successful chase in this calculation.

Johannesburg and Centurion are separate samples

SuperSport Park's all-season first-innings mean is 183.2, compared with 166.8 here. That is a descriptive difference of 16.4 runs between the published means. It does not isolate an effect of altitude, surface or boundary size. Open the comparison page and match the season first: the grounds hosted different opponents and their eligible match counts also vary.

Use the season count before reading a trend

The Wanderers' first-innings average fell from 172.6 in 2023/24 to 149.7 in 2024/25, then rose to 174 in 2025/26. Those figures use seven, three and four innings respectively. The three-innings middle sample is especially sensitive to one result. Read the totals behind it before treating the sequence as a lasting change in the ground.

How common are 200-plus SA20 scores at the Wanderers?

Five of the 20 eligible first innings reached 200 in the four-season sample. Another five ended below 140. That spread is why the 166.8 average cannot stand in for the match-by-match record. A score distribution includes the completed first innings from a tied game; the chasing percentage excludes that game's result.

Does this include the Wanderers' famous international matches?

No. This is an SA20 venue record. International cricket and other domestic competitions do not enter these scores, phase rates or chasing percentages. Check the competition label when comparing this page with a broader Wanderers record.

What does the 167.5 median mean?

Sort the 20 eligible first-innings totals and average the two middle values. The result is 167.5. Its closeness to the 166.8 mean describes the centre of this sample, but does not mean that individual scores usually sit within one run of either figure.

Do the written examples change with the season filter?

No. They describe the 2022/23–2025/26 snapshot reviewed on 19 October 2026, with individual seasons identified where relevant. Use the filtered statistics and match list for the selected season's figures.

Venue background: Official SA20 guide to the Wanderers ↗ · Cricsheet ball-by-ball data ↗

A practical guide to reading these statistics ↗